Graphing Quadratic Functions - Standard Form
In our last post, we learned how to graph quadratic functions in vertex (or graphing) form. We used the equation to find key features like the vertex, line of symmetry, the direction the parabola opens, and whether there is any stretch or compression.
In this post, we’ll focus on graphing quadratic functions given in standard form.
What is Standard Form?
The standard form of a quadratic equation looks like this:
f(x) = ax2 + bx + c
a ≠ 0
Our goal will be to graph the function by finding important points like the vertex, y-intercept, and additional points to shape the parabola. Let’s walk through the process with an example:
f(x) = x2 + 4x + 4
Step 1: Find the X-Value of the Vertex
The vertex is a key feature of any quadratic function, and we can start by finding the x-coordinate of the vertex. To do this, we use the formula:
For our example, where a = 1, b = 4, and c = 4, we substitute these values into the formula:
Now that we have the x-value, we can find the y-value by substituting x = −2 back into the original equation.
Step 2: Find the Y-Value of the Vertex
To find the y-value, we evaluate the function at x = −2:
f(-2) = (-2)2 + 4(-2) + 4
= 4 + (-8) + 4
f(-2) = 0
So, the y-value of the vertex is 0. The complete vertex is (−2,0). We can plot this point on our graph as the vertex.
Step 3: Find the Y-Intercept
The y-intercept is the point where the graph crosses the y-axis, which happens when x = 0. To find the y-intercept, substitute x = 0 into the equation:
f(0) = (0)2 + 4(0) + 4
= 0 + 0 + 4
f(0) = 4
This tells us that the y-intercept is (0,4). We can plot this point on the graph.
Note: The “c” term will be the y-intercept.
Step 4: Use Symmetry to Find Additional Points
One key property of parabolas is symmetry. The line of symmetry passes through the vertex, so any point on one side of the vertex will have a corresponding point on the other side. Since the vertex is at x = −2, the y-intercept (0,4) has a reflected point across the line of symmetry at (−4,4). We can plot this reflected point as well.
Step 5: Find Two More Points
To complete the graph, we want to find two more points. We can choose values for x that are close to the vertex. Let’s pick x = −3 and x = −1, both one unit away from x = −2.
Substitute x = −3 into the equation:
f(-3) = (-3)2 + 4(-3) + 4
= 9 + (-12) + 4
f(-3) = 1
So, one point is (−3,1).
Next, substitute x = −1:
f(-1) = (-1)2 + 4(-1) + 4
= 1 + (-4) + 4
f(-1) = 1
This gives us another point at (−1,1).
Step 6: Sketch the Parabola
Now that we have five points—the vertex (−2,0), the y-intercept (0,4), the reflected point (−4,4), and two additional points (−3,1) and (−1,1)—we can sketch a smooth curve through all of them to complete the graph.
One Last Note: Direction of the Parabola
In this example, the value of a is positive, so the parabola opens upward. If a were negative, the parabola would open downward. In another post, we will explore quadratic transformations more.
Practice Time!
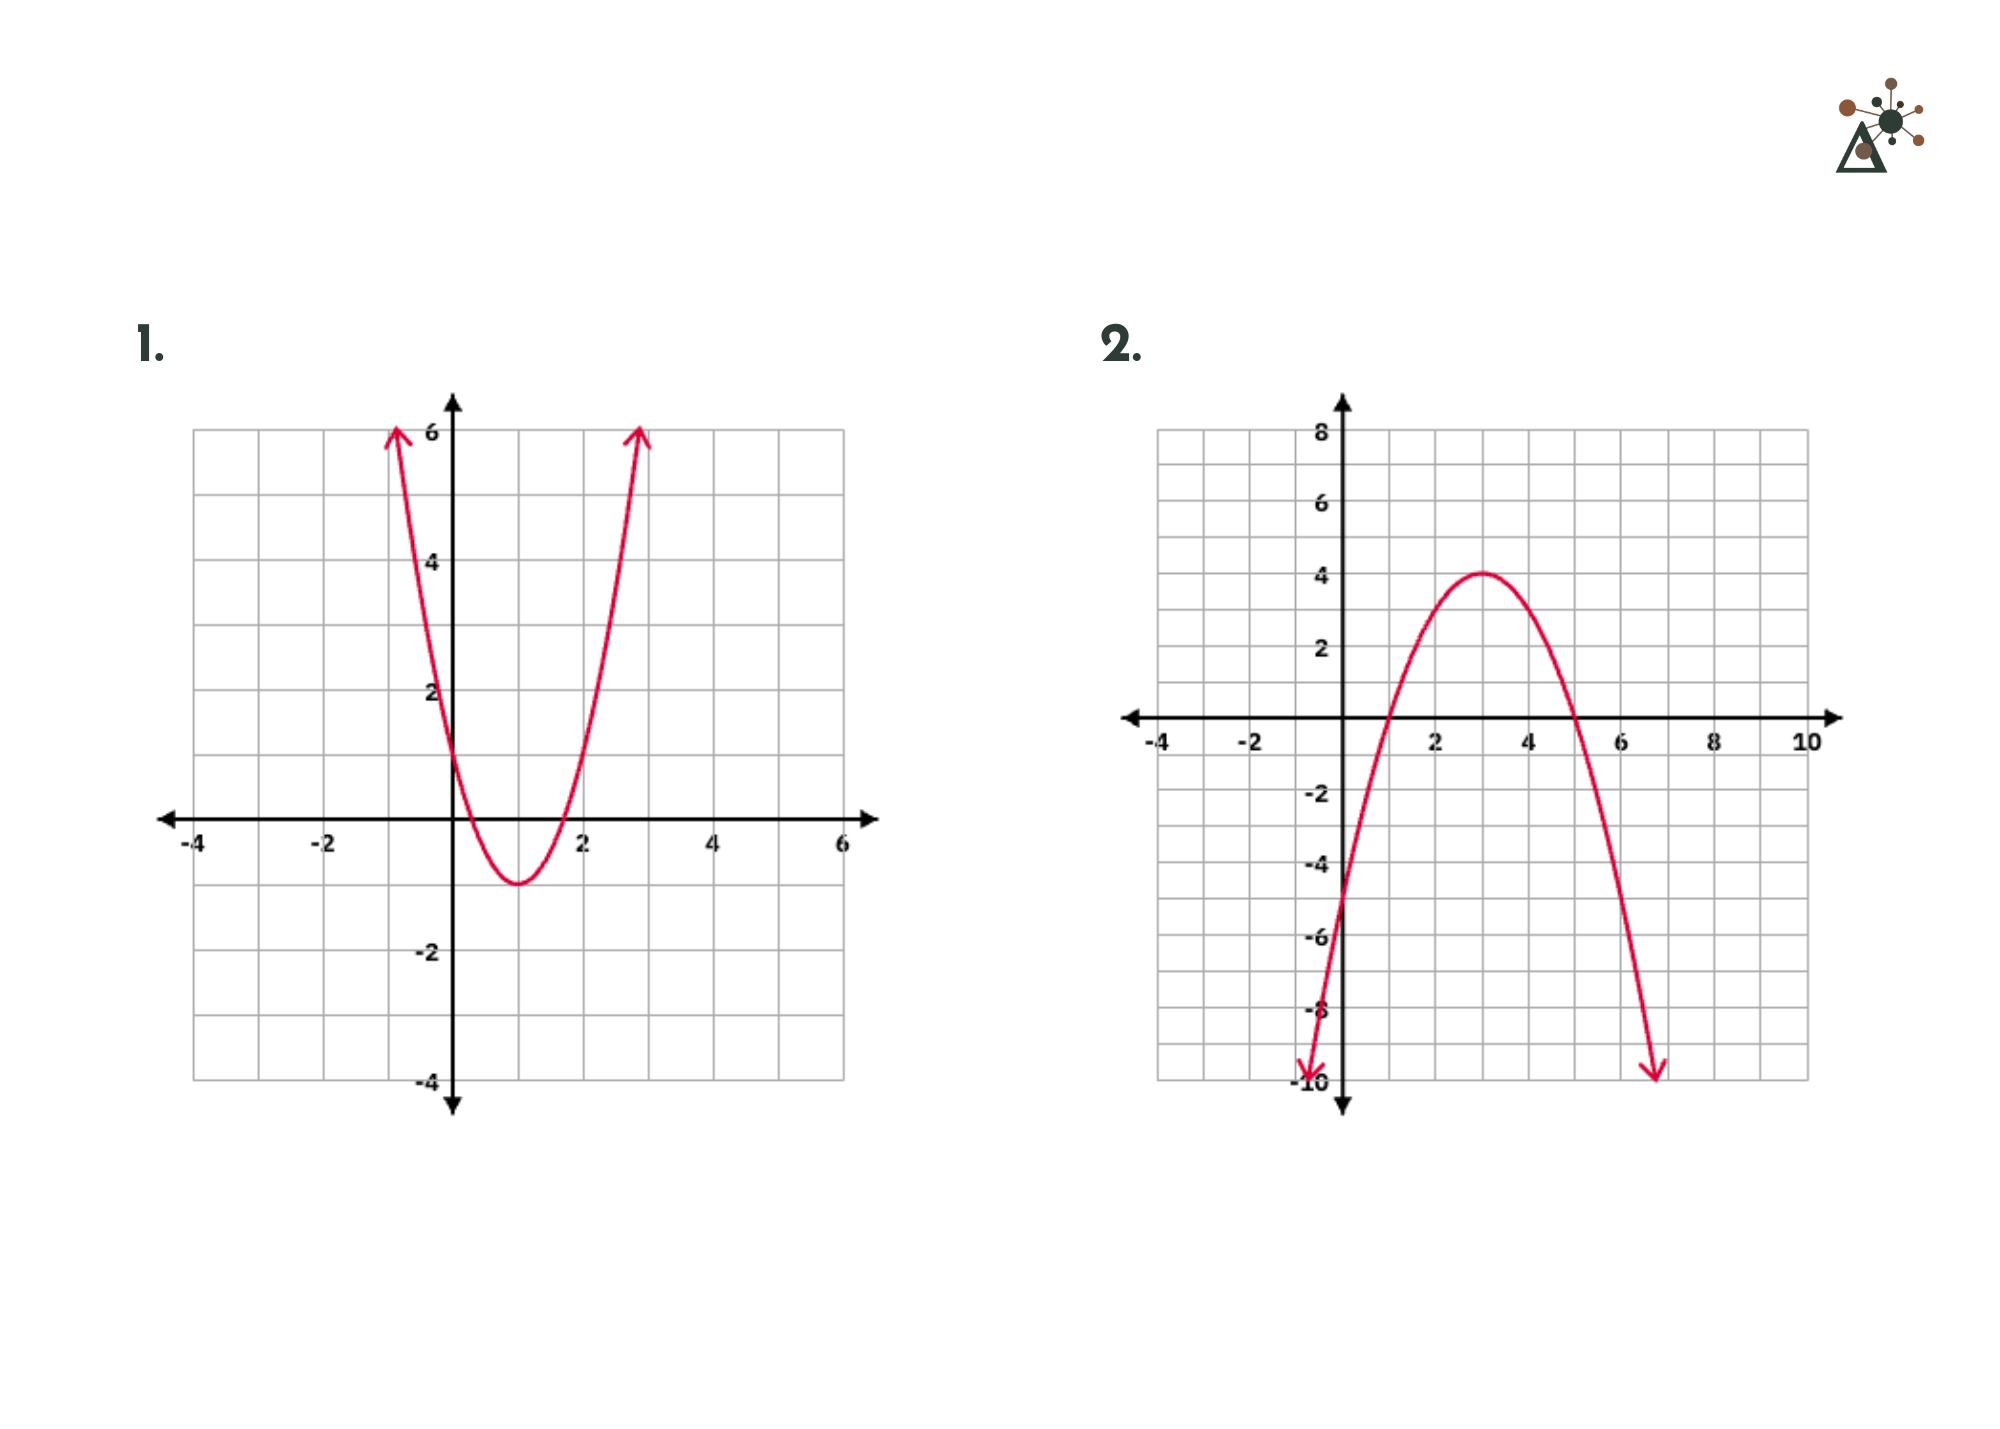
Now it’s your turn. Try graphing the following quadratic functions in standard form:
- f(x) = 2x2 - 4x + 1
- f(x) = -x2 + 6x - 5


