

Graphing Quadratics (Vertex Form)
Quadratic functions are a type of polynomial function characterized by variable and constant terms. While these variable terms can have exponents of 1 or 2, every quadratic function will always include at least one term with a variable raised to the second power. The term with the highest exponent is called the leading term, and in quadratic functions, this term will always have an exponent of 2.
Examples of Quadratic Functions:
- f(x) = x2
- f(x) = x2 + 2x + 1
- y = (x+5)2 + 3
- f(x) = (x-3)(x+1)
Quadratic functions can be written in three different forms:
- Vertex Form: f(x) = a(x - h)2 + k
- Standard Form: f(x) = ax2 + bx + c
- Factored Form: f(x) = (x+m)(x+n)
Each of these forms is useful for representing quadratic functions in different contexts. In this post, we'll focus on graphing quadratic functions, starting with the parent function, which is the simplest form of a quadratic:
f(x) = x2
Understanding the Parent Function
Before we dive into graphing other quadratics, let's examine the parent function:
f(x) = x2


Key characteristics of the parent quadratic function:
Shape: The graph forms a "U" shape, known as a parabola.
Symmetry: Quadratic functions have symmetry around a vertical line passing through the vertex.
Vertex: The lowest (or highest) point of the parabola is called the vertex, which in this case is at (0,0).
Domain and Range: The domain is all real numbers, while the range is [0,∞).
If the function is positive the lowest value for the range will be the y-value of the vertex.
If the function is negative the highest value for the range will be the y-value of the vertex.
Graphing Quadratics in Vertex Form
Let's explore how to graph quadratic functions using the vertex form:
f(x) = a(x-h)2 + k
We will examine how the parameters a, h, and k affect the graph.
1. Scale Factor (a):
The value of a determines whether the parabola is vertically stretched, compressed, or reflected:
- When 𝑎 > 1, the graph experiences a vertical stretch, making the parabola narrower than the parent function.
Example: f(x) = 2x2, with a = 2. Graph will be stretched by a scale of 2. - When 0 < 𝑎 < 1, the graph undergoes a vertical compression, making the parabola wider.
Example: f(x) = 1/2 x2, with a = 1/2. Graph will be compressed by a scale of 1/2. - When 𝑎 < 0, the graph is reflected across the x-axis, flipping the parabola upside down.
Example: f(x) = -x2, with a = -1

2. Horizontal Shift (h):
The h term controls the horizontal shift of the parabola:
- If ℎ > 0, the graph shifts to the right.
Example: f(x) = (x-2)2, with h = 2. Graph will be shifted two units to the right. - If ℎ < 0, the graph shifts to the left.
Example: f(x) = (x+2)2, with h = -2. Graph will be shifted two units to the left.

Because of the way the vertex form is presented, the sign of the h term will appear opposite.
3. Vertical Shift (k):
The k term controls the vertical movement of the graph:
- If 𝑘 > 0, the graph shifts upward.
Example: f(x) = x2 + 3, with k = 3. Graph will be shifted 3 units upward. - If 𝑘 < 0, the graph shifts downward.
Example: f(x) = x2 - 3, with k = -3. Graph will be shifted 3 units downward.

The Vertex and Line of Symmetry
The vertex of the parabola is located at (h, k). The value of h also defines the line of symmetry, which is the vertical line x = h that divides the parabola into two mirror images.
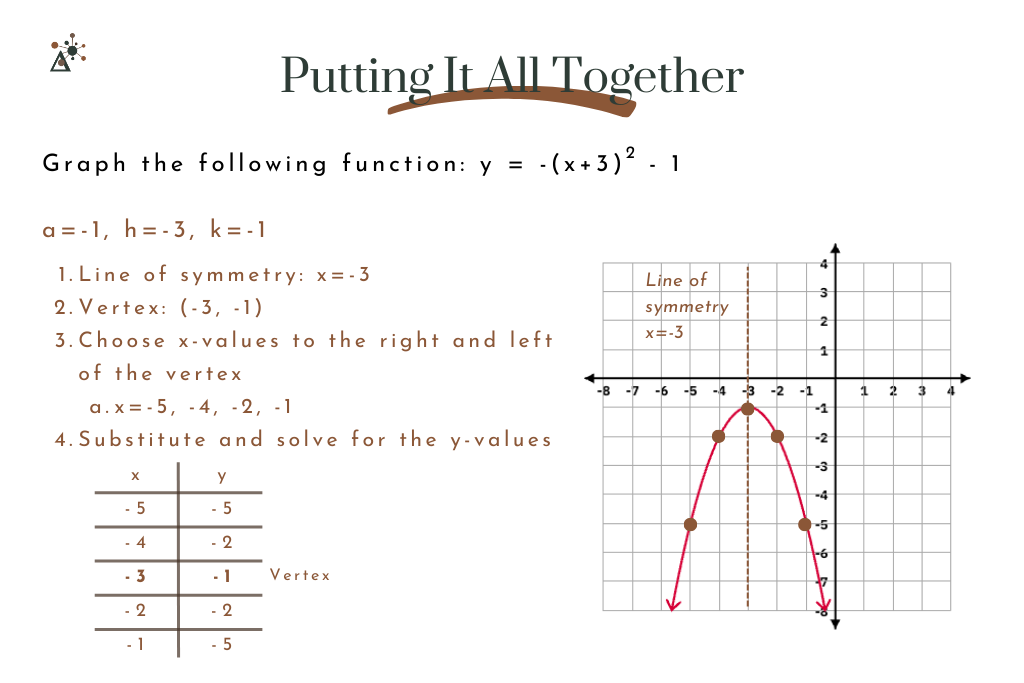
Putting It all Together: Steps for Graphing in Vertex Form
To graph quadratic functions in vertex form. It is important to define a, h, and k. Then, follow these steps:
Identify the line of symmetry: This is the vertical line x = h.
Find and plot the vertex: The vertex is at (h, k).
Choose two x-values to the left of the vertex and two x-values to the right.
Substitute these x-values into the equation to find corresponding y-values, and plot the points.
Draw the parabola, ensuring it follows the direction of the scale factor a.
Practice Time!
Now that we've covered the basics of graphing quadratics in vertex form, it's time to practice! The answers can be found at the end of this post.
Use the steps above to graph the following functions:
- f(x) = 2(x - 1)2 + 3
- f(x) = -1/2(x + 4)2 - 2
- f(x) = (x - 5)2 - 4
Conclusion
When graphing quadratics in vertex form, it is important to identify the defining features of the graph. We want to be able to identify the line of symmetry, the vertex, any stretch, and whether the graph will open upward or downward. In our next post, we will look at how to graph quadratic functions when given the standard form.
